Docker Small Hints #6: Using Cloudwatch in combination with Log Entries Management Solution
As explained in my last article “
Using Cloudwatch Alarms for monitoring AWS Elastic Beanstalk Docker Instances“ I set up a Cloudwatch Alarm to detect inactivity/potential hanging scenarios of my micro service.
In this article I will drill down and give you some ideas how to configure your
logentries engine.
As one can see in the following example the Cloudwatch Alarm was sending out an Alarm at 11:20 about inactivity of the microservice, which was released 5 minutes later again.

So it seems that this was a false alarm. For the root cause analysis I normally check first then my logentries management instance.
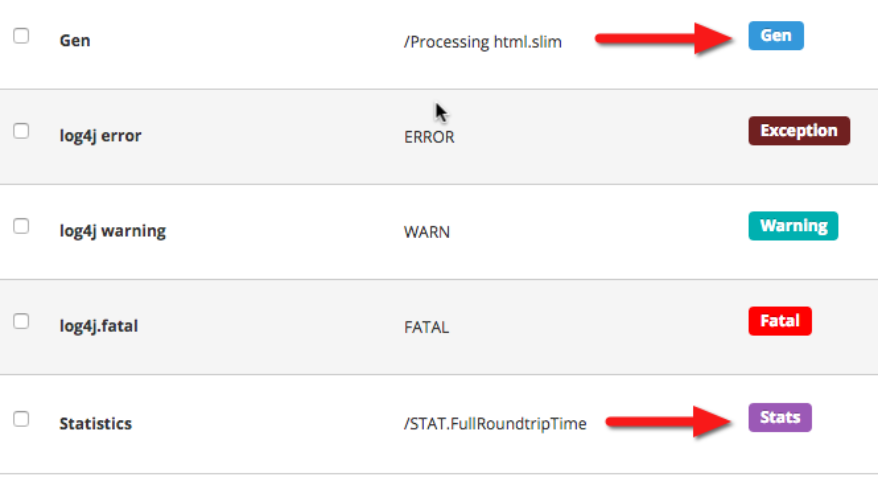
One powerful feature of logentries is to define any kind of tag for a text pattern in your log event stream.
For my microservice I defined amongst others the following tags
- „Gen“ which is attached to log events which contains the text „html.slim“. The microservice produces this log entry when a new article is added to the blog and the middleman regeneration will take place
- „Stats“ which is attached to log events which are providing processing time statistics for a blog checking and generation cycle. They contain the text „STAT.FullRoundtripTime“
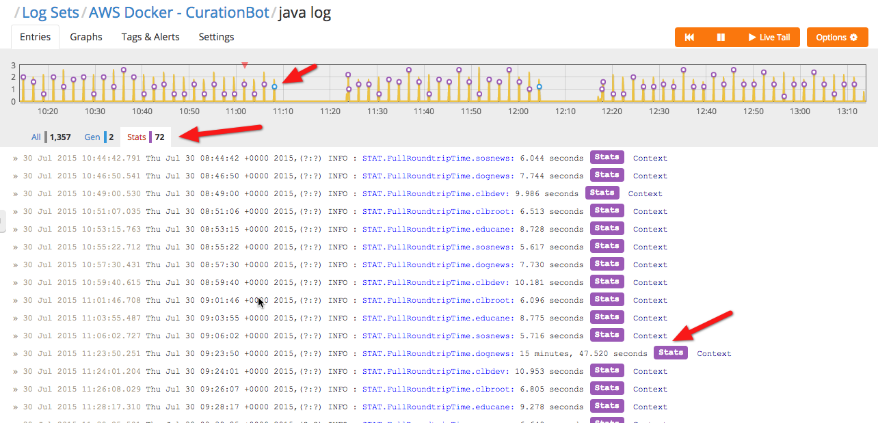
The screenshot below shows me immediately that there was an inactivity phase starting around 11:10 which was terminated around 11:20. The logentries management solution didn’t get any event from my micro-service and therefore the Cloudwatch kicked off.
By selecting the „Stats“ filter I can conclude that the roundtrip time for the blog dognews was around 15 minutes, which was the reason for the Cloudwatch alarm.
If you look at the graph you can see that the inactivity period is happening after a “light blue“ log event, which is the color of the „Gen“ tagged log entries.
Filtering now for the „Gen“ log events, shows me immdeiately the root cause, i.e. the middleman generation cycle when a new entry is added lasts for 15 minutes for the dedicated blog „dognews“.
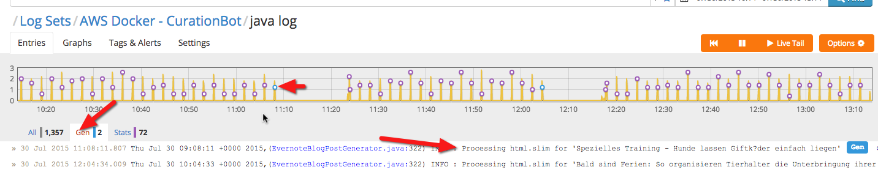
Taken into consideration that the blog is the largest one currently managed by the Cloudburo Curation Platform with over 300 articles the reason is clear: Middleman is regenerating the static website after each new article and this takes now considerable time (i.e. processing categories pages etc.). It also means I have to exploit possibilities to parallelize this processing area before going live.
This concludes the article which gives you some hints how to use the logentries management solution in combination with tags in order to get a quick overview about the state of your microservice. Carefully tagging your logentries allows you to get an overview of the health and status of your application in a very short period of time.
This blog is managed fully out of Evernote by using the Cloudburo Curation Platform. Interested - head over to https://cloudburo.net/docs/products.html.
comments powered by Disqus