Docker Small Hints #5: Using Cloudwatch Alarms for monitoring AWS Elastic Beanstalk Docker Instances
My first docker based
content curation microservice is in early beta mode and is working reliably for a longer period of time now. The last deployment of the application was up and running for 46 days without any major operational incident.
Suddenly the Micro-service stopped to generate blog entries out of Evernote Notes. I wasn’t monitoring this constellation up until now and detected it just about 4 hours later. Not very good when you want to go live.
So time to start monitoring such kind of incidents by using CloudWatch and start sending out alarm emails in order to be capable to keep the service live all the time.
Elastic Beanstalk automatically uses
Amazon CloudWatch to help you monitor your application and environment status. The Amazon CloudWatch console gives you an overview of all of your resources as well as your alarms.
Amazon CloudWatch to help you monitor your application and environment status. The Amazon CloudWatch console gives you an overview of all of your resources as well as your alarms.
In order to handle this new kind of incidents it’s necessary to create a new alarm which detects the pattern, but …
… first the root cause analysis must be done, what the heck stopped to work as expected.
My primary monitoring application for the java based micro service is
logentries.com. The java/groovy application on the EB Docker instance will send various kind of log information (via log4j to the logentries log management and analytics application).
As one can see in the below 24 hours log, everthing seems find up around 10:00 where no micro service log entries were shown anymore.
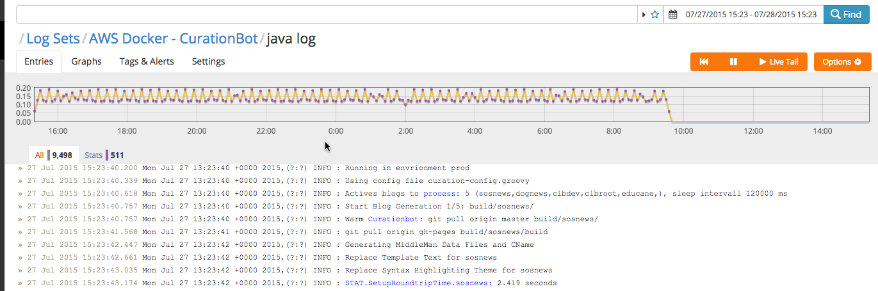
That means something stopped working on the Amazon Docker instance, which wasn’t detected by AWS EB manager itself. E.g. in case my Microservice App would memory leaked over time and crash at one time, the AWS EB manager would detect that an restart the microservice automatically (making the application available again after some minutes). Such an incident wouldn’t result in the above pattern.
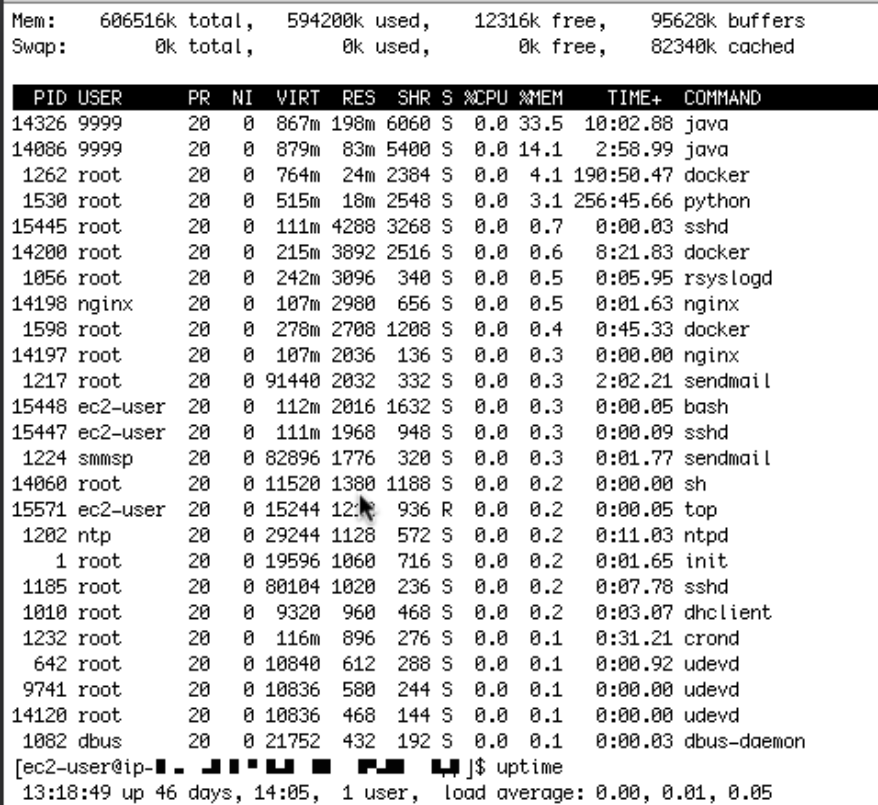
So I had to go on and check the AWS EB Docker instance logs directly (refer to the
following article how to achieve that). A first glance showed me that the java based microservice application was still running (on top of the list, consuming the major part of the memory). No restart or anything else happened, uptime was 46 days.
So let’s check then the application log of the eb docker container, which can be found in the /var/log/… directory.
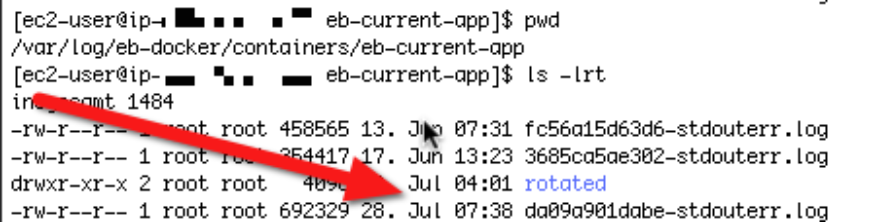
Counter checking with the last message received by logentries, it lead to the conclusion, that the local log is in sync with the logentries remote one. So the java process stopped working at that point in time and wasn’t producing any log events anymore. So we have to establish a monitoring strategy which is capable of identifying our hanging micro service process.
Time to define an AWS Cloudwatch Alert which will allows me to detect this inactivity/hanging process behavior.
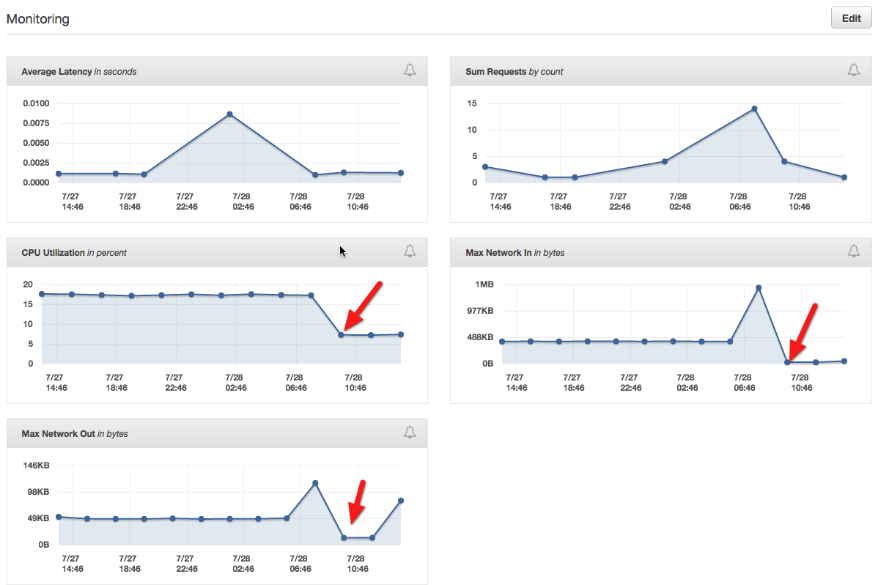
Looking at the EB Monitoring in the Dashboard shows me that such an incident would result in “Max Network In“ flow of a small amount of KB’s (refer to the
following article to understand the high level EB concepts). This seems to be the strongest signal for such a behaviour. Using the low CPU Utilization as a signal, seems not advisable, due to the fact that this threshold could shift in case of auto scaling scenarios.
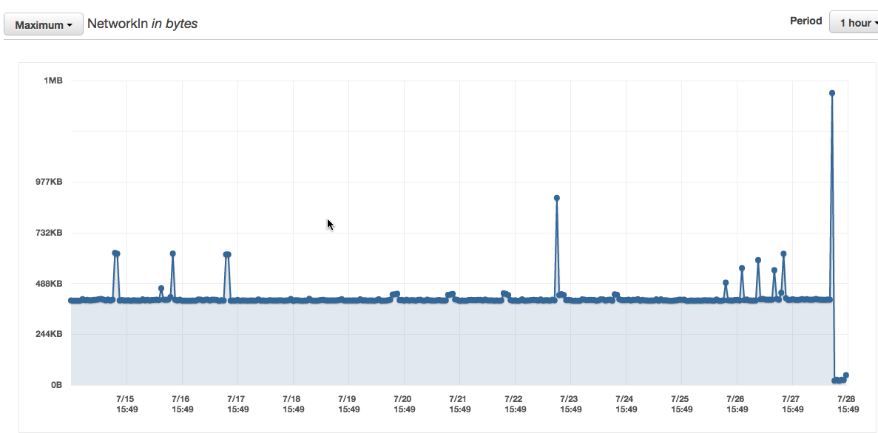
Just to be sure I checked the graph over a two weeks period of time. It shows me that this seems a good signal for a hanging microservice java process.
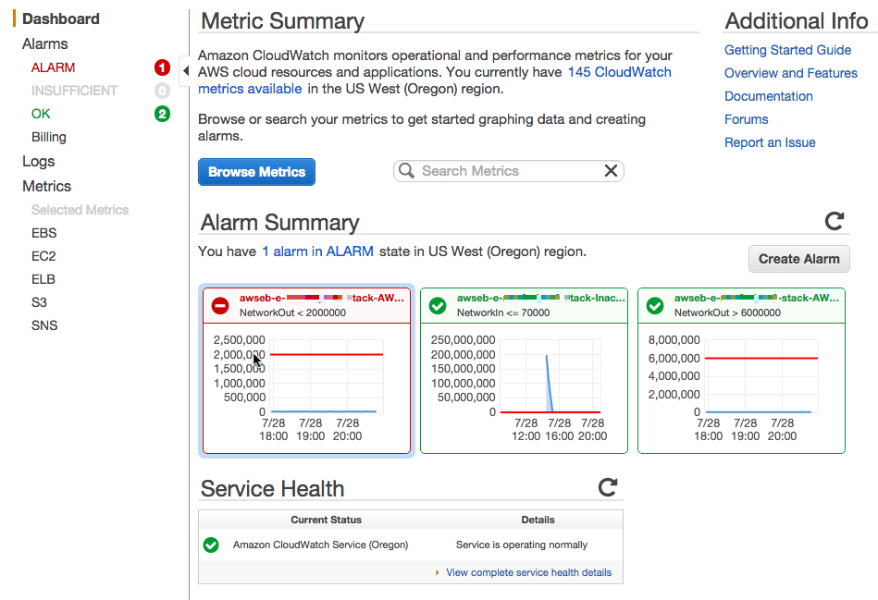
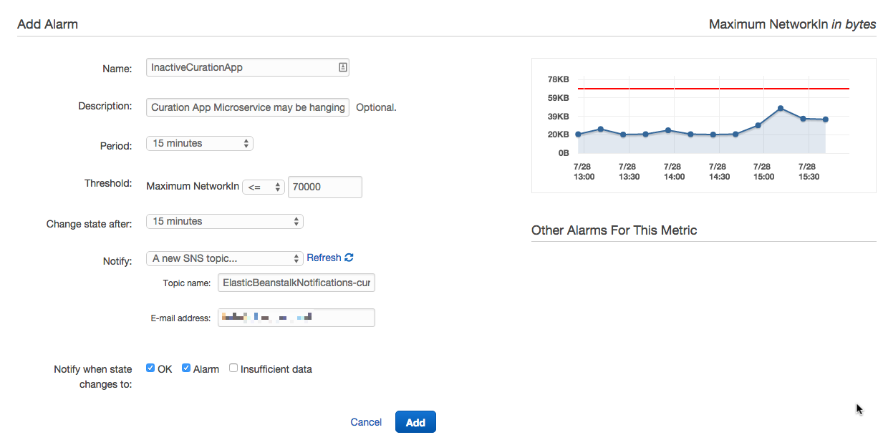
Now let’s create an Alarm then, which is straightforward and easy and can be done on the EB Monitoring site directly.
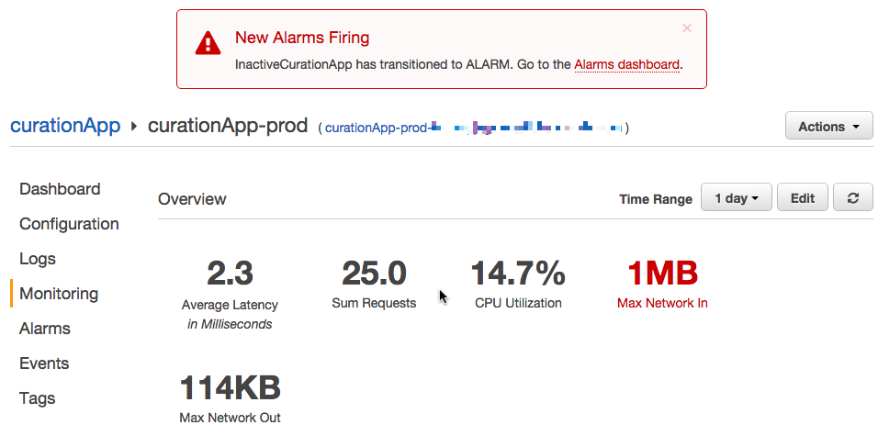
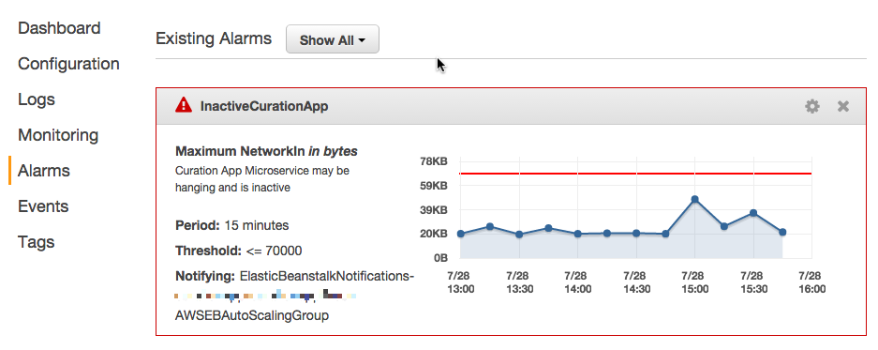
Let’s go back to the Dashboard to see if the Alarm is, correctly shown. Yes it got triggered.
The Alarm Dashboard shows the existing Alarm, very nice. It will be also visible on the Cloudwatch Dashboard site.
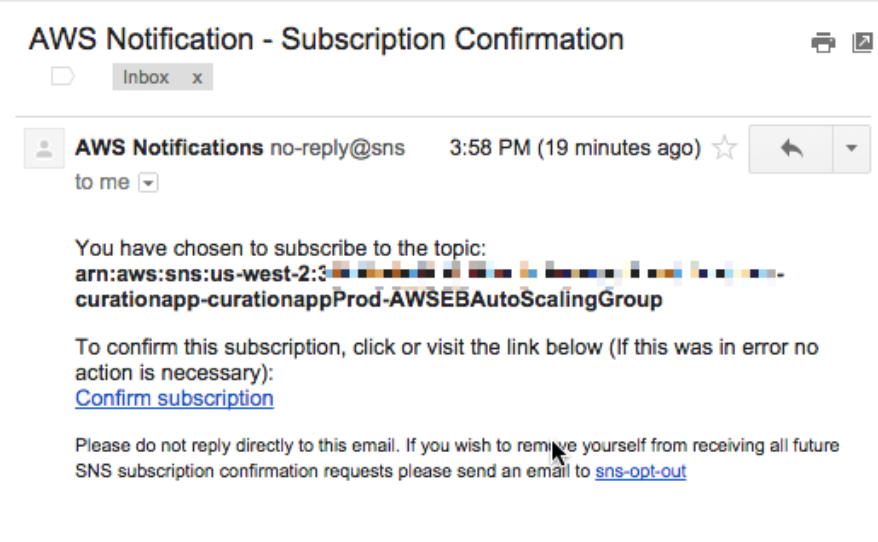
I also get notified via Email by the AWS Notification service to subscribe for the topic.
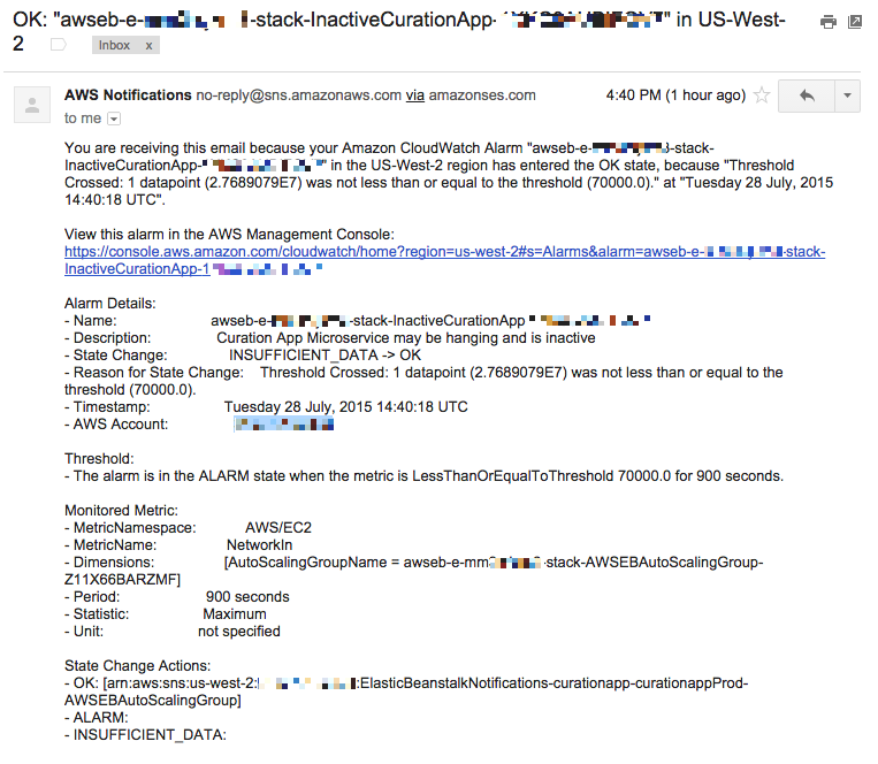
Having done that I will now receive an email when my microservice is hanging or inactive for more than some minutes. It allows me to timely restart or investigate the problem which results in a better service level for my clients.
In a next article I will investigate in the possibilities to automate the creation of CloudWatch Alarms during my EB Environment creation step.
comments powered by Disqus