The Diagrammer Series - How To Read The Diagrams
Understanding Business Concept Model Diagrams

Bibliography
Dependent on your background, the reading of the UML diagrams in the context of the Diagrammer article series may not be straightforward. But I can assure you that you get quickly on speed having the main concepts understood.

The diagram technique is using the Unified Modeling Language (UML)
The Unified Modeling Language is a general-purpose, developmental, modeling language in the field of software engineering that intends to provide a standard way to visualize the design of a system
[5]
.
The flexibility of the modeling language allows you to visualize almost any aspect of a system by using multiple diagram types, as well as applying UML profiles.
By the way, with the phrase system, we don’t mean only IT systems but any kind of it
A set of things working together as parts of a mechanism or an interconnecting network.
[6]
As one can see from the definition above, the general concept “Thing” is the nucleus around which a business concept models are built up. More about “The Thing” later.
The FIBO Model as the Semantic Anchor
The article series concentrates on a conceptual model of Decentralized Finance aspects. In order not to reinvent the wheel, we establish the model on top of the FIBO model, which serves as the semantic anchor.
The Financial Industry Business Ontology (FIBO) is a business conceptual model developed by the Enterprise Data Management Council (EDMC) about how all financial instruments, business entities, and processes work in the financial industry. [7]
By linking our model to the FIBO one, we get a firm root into the concepts as understood and used by people in the finance industry for each of their components, and the terms used for them.
FIBO is intended for a range of users including in its simplest form as an English language Glossary that could be used to inform a bank or a regulator’s Data Dictionary, or the actual FIBO Data Dictionary could be repurposed as a bank or regulators Data Dictionary. In its most complex form, FIBO in its native Web Ontology Language (OWL), could be used as a bank’s operational ontology. There are also those external uses of FIBO such as FIBO.schema.org which uses FIBO as a reference to find specific information on the Internet [8]
So what’s an ontology then
An ontology (in OWL) is made up of statements about Classes (i.e., sets of things) and Properties (ways that things relate to other things). FIBO defines the sets of things that are of interest in financial business applications and the ways that those things can relate to one another. In this way, FIBO can give meaning to any data (e.g., spreadsheets, relational databases, XML documents) that describe the business of finance. FIBO considers both Classes and Properties to be Concepts. The languages of Ontologies were originally developed by the US DoD and are codified by the World Wide Web Consortium (W3C).
[8]
We don’t dive here into more detail about OWL, which is a Semantic Web language designed to represent rich and complex knowledge about things, groups of things, and relations between things. We do that at a later stage and concentrate on the diagrammatic representation of concept models, which can be expressed in UML class diagrams.
There are two main categories of diagram types describing an aspect of the model
-
Structure diagrams emphasize the things that must present in the system being modeled
-
Behavior Diagrams emphasize what must happen in the system being modeled
We use both kinds of diagrams in the article series but start for now with Class Diagrams.
Class Diagram
Structural models in UML, especially Class models, are frequently used to define and visualize business concept models as defined above.
Concepts are represented by classes, while relationships are represented by associations.

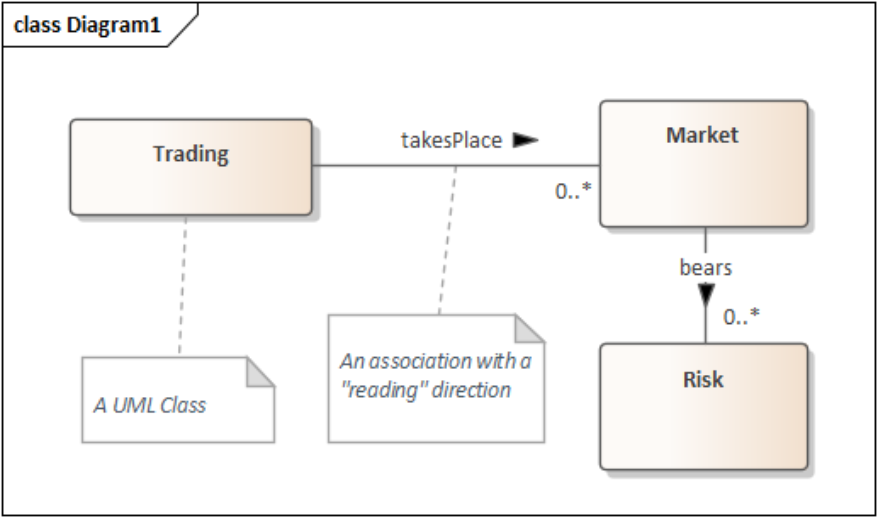
For example, the Diagram1 consists of
-
Three Classes “Trading,” “Market” and “Risk”
-
Two Associations “takesPlace” and “bears”
-
The two associations have multiplicity associated with the specific classes “Market” and “Risk.”
The overall diagram reads as follows:
“Trading takes place in zero to multiple Markets, and each Market may bear zero to multiple Risks.”

Two additional relationship types play as well a role in our concept modeling
-
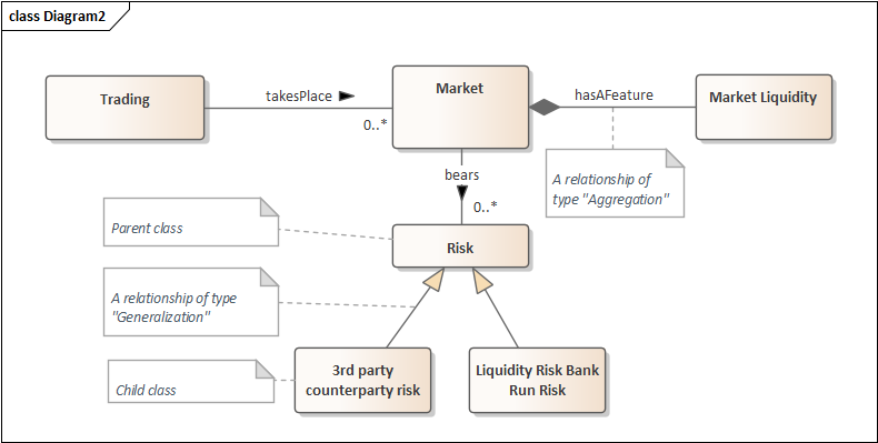
Generalization Relationship: a generalization relationship is a relationship in which one class element (the child) is based on another class element (the parent). The two concepts in relation have to be of the same type. The child element represents a refinement or more specific element of the parent one. For example, two specific Risk Types.
-
Aggregation Relationship: an aggregation relationship is a relationship in which a class is a part of or subordinate to the other element. In a way, it assembles or configures a more complex object. For example, an important aspect of a Market is Market Liquidity. We use the aggregation here because the Liquidity is a part of the Market itself. It would not exists on its own when there is no Market.
Naming Conventions
In Associations and Relations, we use the terms
-
mayHave, to express the optionality in the relation, i.e., the multiplicity 0..1
-
hasA, to express the multiplicity of 1
That’s the minimal primer about Class diagrams. We enhance and enrich the diagrams in the context of FIBO ontology mapping, but let’s keep it simple for the moment, one step after the other, and switch over to our actors.
The Diagrammer’s Actors – Alice & Bob
Exploring important real-world concepts in diagrams also requires actors who engage and interact with systems and individuals.

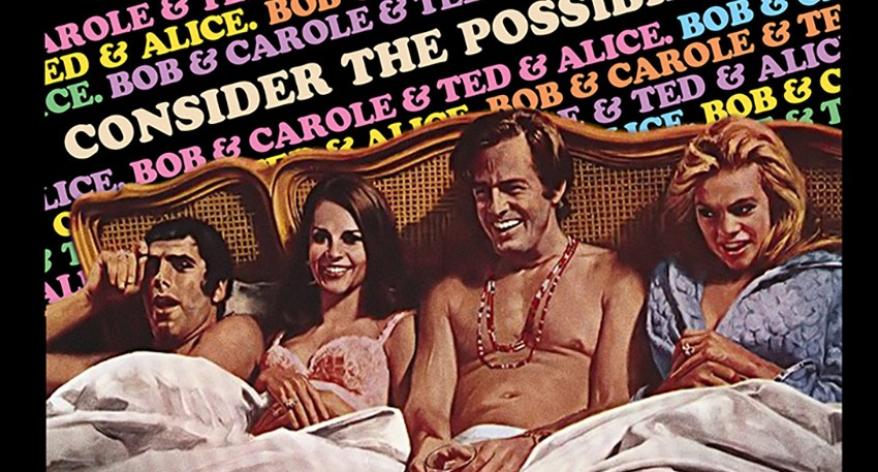
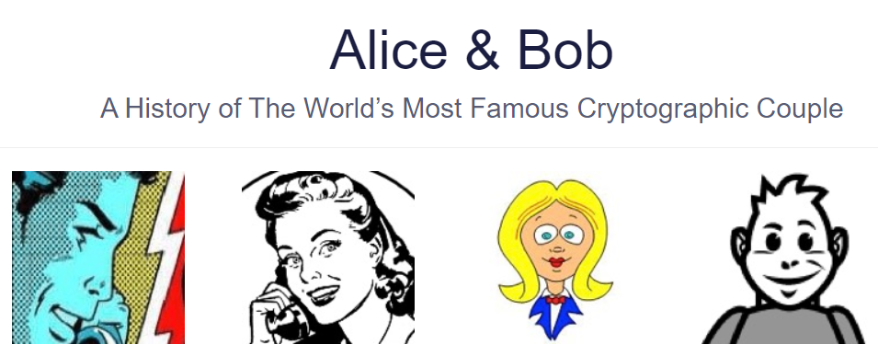
Maybe an inspiration for the most famous crypto couple: Movie 1968 “Bob & Carol & Ted & Alice” (
Link
)
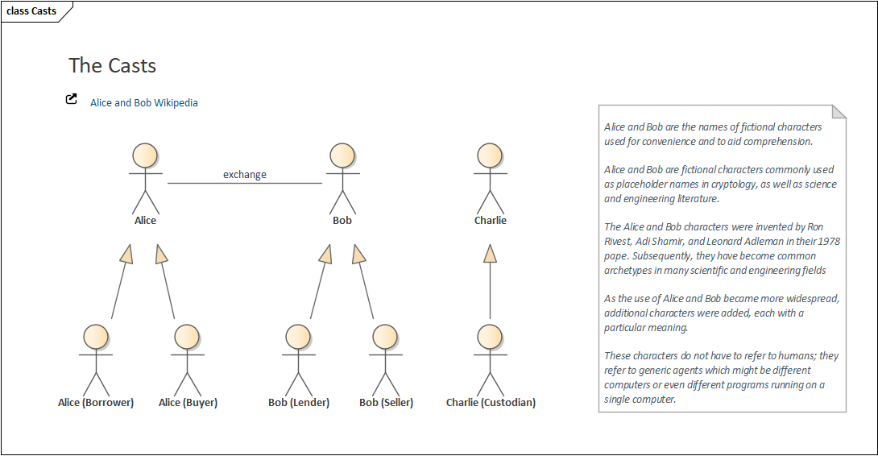
In the diagrammer series, we are following the actor naming approach, which was introduced by Ron Rivest, Adi Shamir, and Leonard Adleman in their crypto paper 1978 and is as of today the de-facto standard in the crypto and engineering world when it comes down to “place-holder” names, aka “Alice and Bob.”
Alice and Bob are the names of fictional characters used for convenience and to aid comprehension. For example, “How can Bob send a private message M to Alice in a public-key cryptosystem?” is believed to be easier to describe and understand than “How can B send a private message M to A in a public-key cryptosystem?”
In cryptography and computer security, Alice and Bob are used extensively as participants in discussions about cryptographic protocols or systems. The names are conventional, and other than Alice and Bob often use a rhyming mnemonic to associate the name with the typical role of that person.
[9]
Over time a full cast of additional actors was introduced; you can find a list here [9]. As we progress in the series, we introduce new actors - with a rhyming mnemonic - if necessary.

In the example above, Alice plays a role as “Alice the Buyer” who will interact with “Bob the Seller,” as well as “Alice the Borrower,” which interacts with “Bob the Lender.” “Charlie the Custodian” may play a role as well.

That’s it for today; we are now ready to dive into the DEFI concept models…
|
[7]
|
“Enterprise Data Management Council (EDM Council),” EDMCouncil, [Online]. Available: https://edmcouncil.org/.
|
|
[8]
|
“FIBO Primer,” EDM Councile, June 2019.
[Online]. Available: https://cdn.ymaws.com/edmcouncil.org/resource/collection/16D6DC67-430E-4F75-9E07-08B1EC228091/FIBO_Primer_v0.2.pdf.
|
|
[9]
|
“Wikipedia Alice and Bob,” Wikipedia, [Online].
Available: https://en.wikipedia.org/wiki/Alice_and_Bob.
|
comments powered by Disqus