The Diagrammer Series – Explaining The DEFI World In Diagrams
Mergenthaler’s Diagrammer disrupted the graphs room in the seventies
 Mergenthaler’s Diagrammer to automate the drafting in the seventies
 The Diagrammers to automate the drawings in 2020
 Article series ambition to establish a DEFI Ontology
The goal of the “Diagrammer Series” is to explain the evolving systems landscape and its associated concepts in the context of Decentralized Finance in a visualized way using (UML) diagramming techniques.
When researching for a blog series name, the word “Diagrammer” jumped into the mind. Similar to the words “the banker,” “the writer,” “the programmer,” “the diagrammer,” would describe the person
who documents the systems and concepts of the world in diagrams and drawings to provide more clarity and helps for a better understanding of them.
Well, the word Diagrammer doesn’t exist according to the Oxford dictionary, so I did some Google search queries to understand how the world is commonly used in the world.
The search brought me to a very interesting Video published via the Vimeo platform [1], which explains the Mergenthaler’s Diagrammer, an automated machine used in the seventies for the production of printed quality engineering drawings and photographic films.
Amazed by the approach used fifty years ago to tackle the automation of diagramming, I thought it was a perfect fit to kick off my Diagrammer series to explore systems and concepts in the new world of decentralized finance.
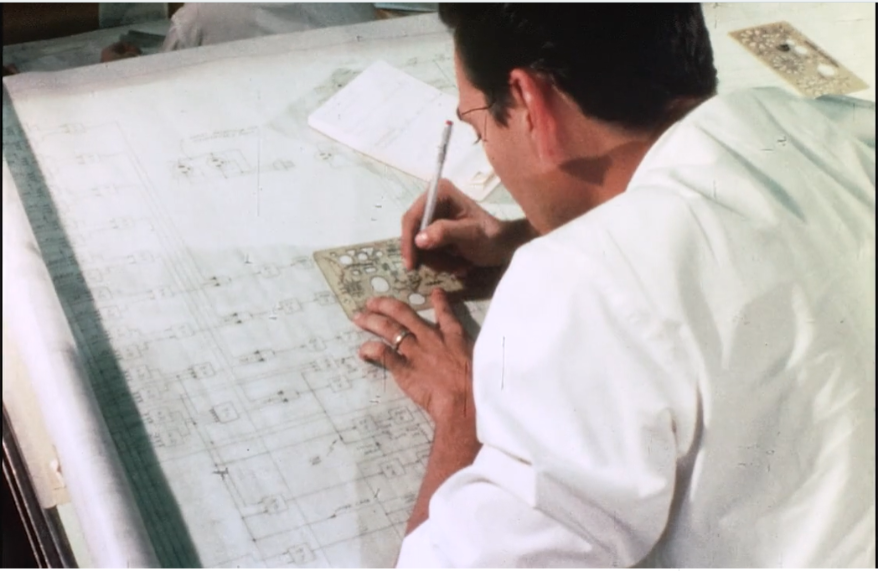
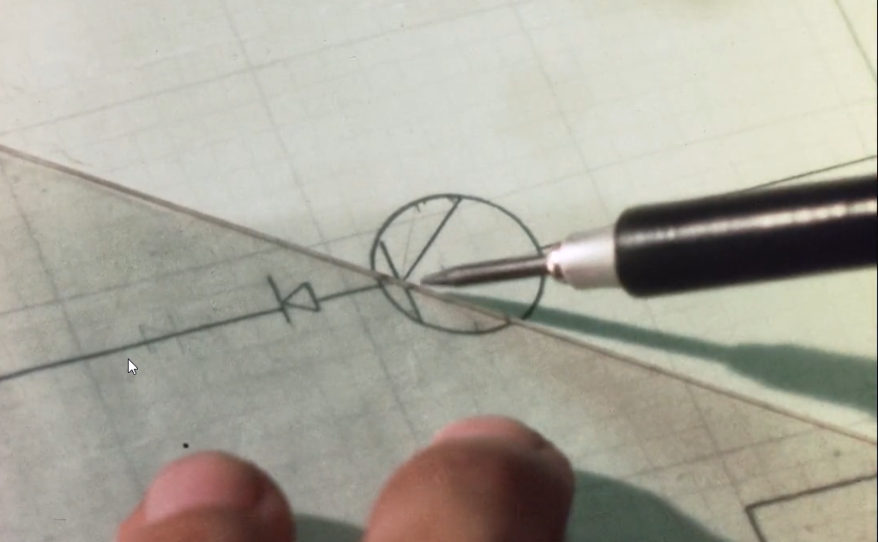
Producing engineering diagrams in the seventies was a laborious task, which involved a lot of manual, complex drawing tasks in large graph rooms.
Everything had to be drawn by hand with a pencil, which may result in a drafting bottleneck in the overall engineering process.
So the Mergenthaler Linotype Company
-
which was founded in 1886 by Ottmar Mergenthaler in the United States in 1886 and revolutionized the book and newspaper typesetting process with its famous Linotype machine – was searching for a practical approach to automating drafting.
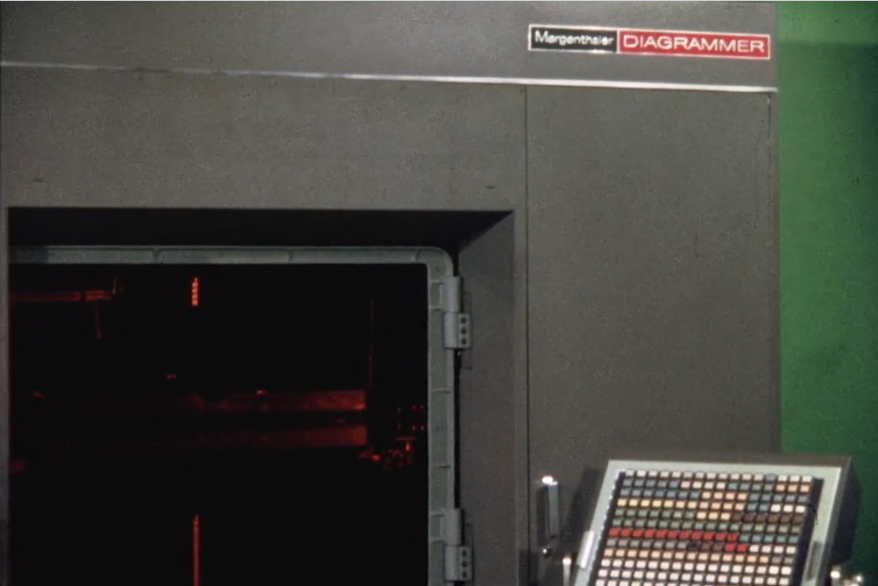
They found in the Diagrammer - the so-called “Shirt Sleeves Automation” – a solution which would tackle the photo drafting bottleneck an reduce the graph room operational costs, as well as produce superior diagram quality than the manual output.
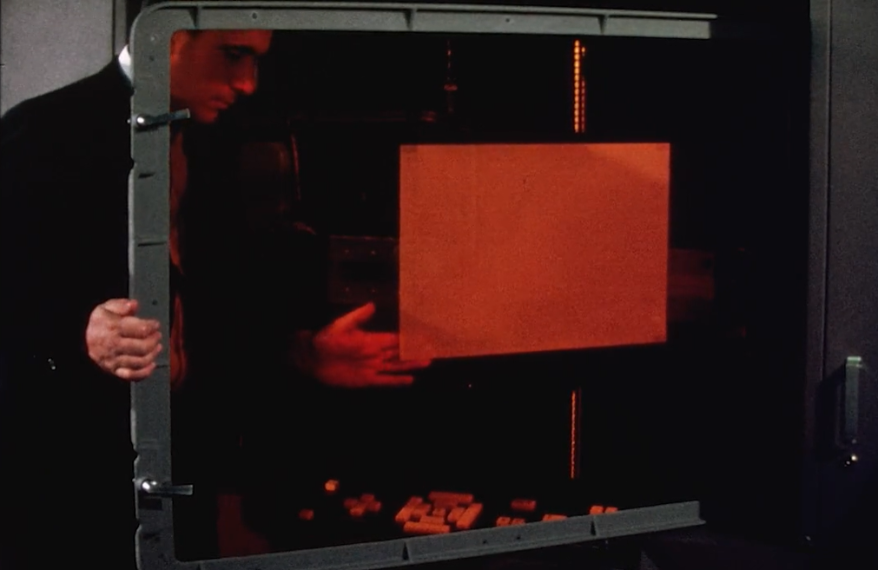
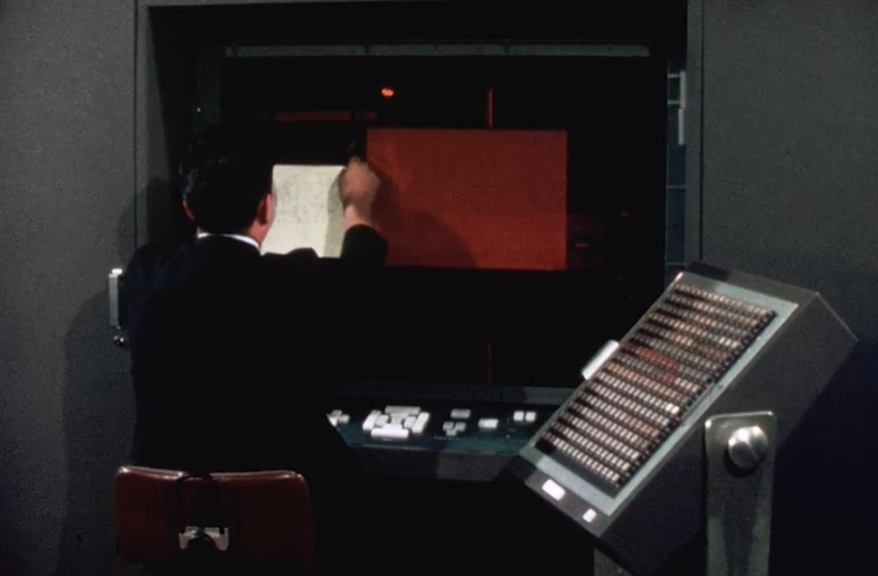
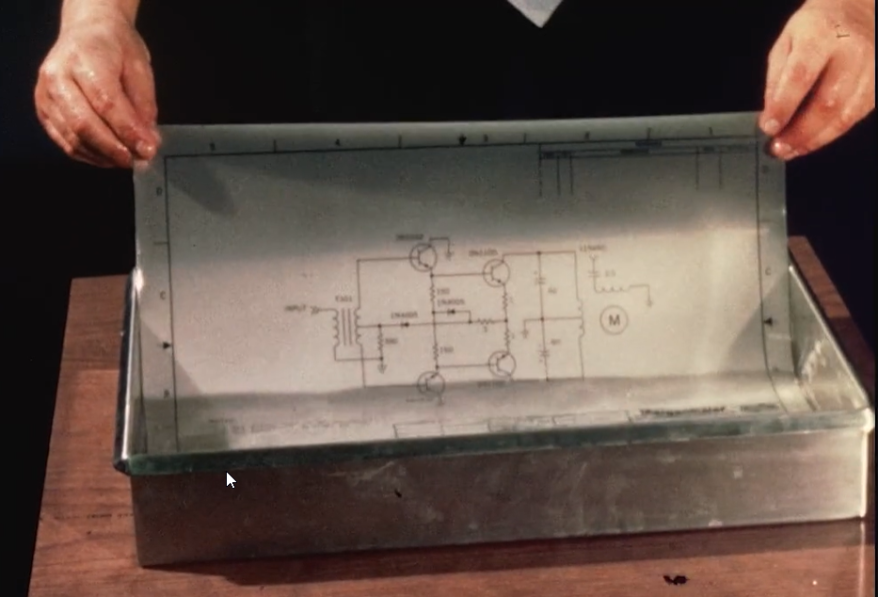
In the production of a single diagram, the operator attaches a sheet of film behind the viewing screen of the operator unit.
After receiving a rough sketch of the drawing, he attaches it to the front of the viewing screen to be used as a progress reference during the production cycle.
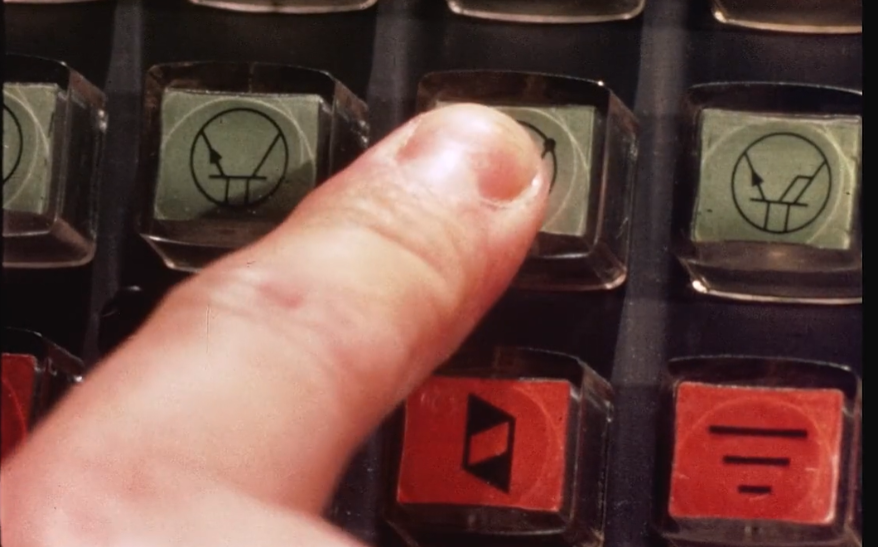
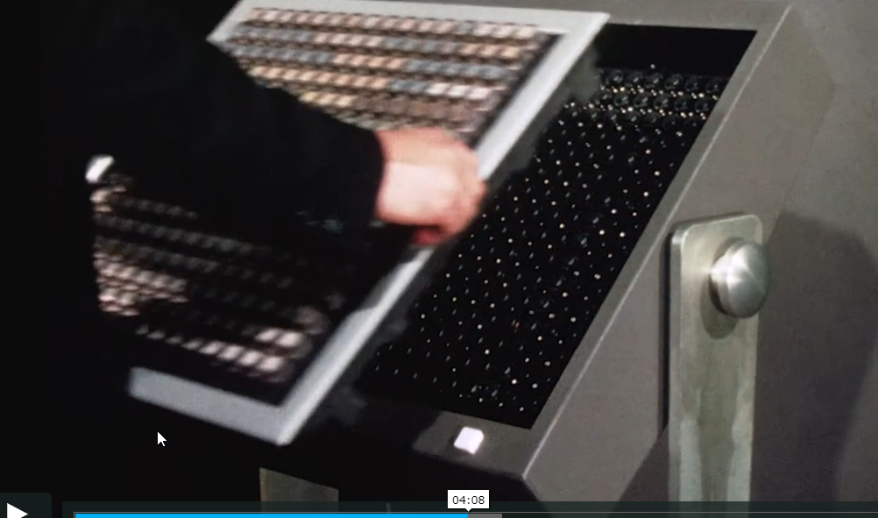
The drawing itself is done via the symbol buttons panel, which can hold up to 256 symbols.
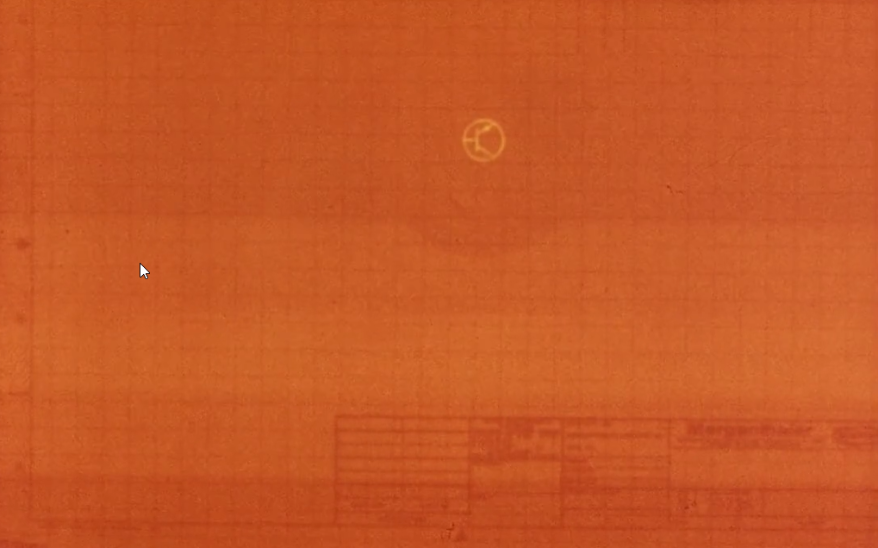
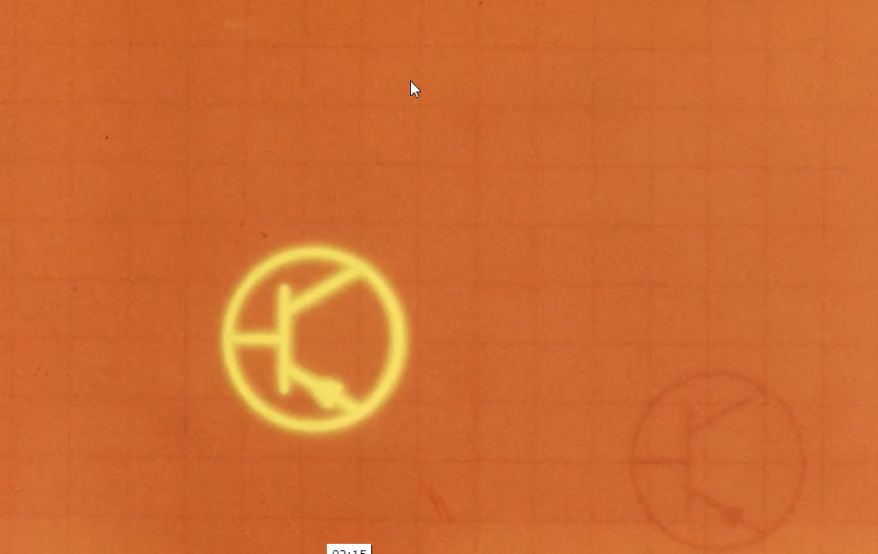
The symbol is optically projected onto the screen and can be moved around to bring it to its proper location and orientation.
By pressing the Expose button, the symbol was recorded on the special film. This process takes less than a second and allowed to speed up and standardize the drawings.
In the end, normal film development was necessary to get the diagrams done.
Quite amazing how, in the early days of computing, drawing processes were automated and standardized. According to the video, the whole process was four times as fast as manual drawings.
I suggest to watch the full video; it’s a very good example of superb design craftmanship. The video outlines multiple features of the modular built-up Diagrammer.
For example, the inherent flexibility of the symbols button panel, allowed to “program” the Diagrammer for drawings and diagrams of any engineering field. Either the whole panel could be replaced or a dedicated symbol.
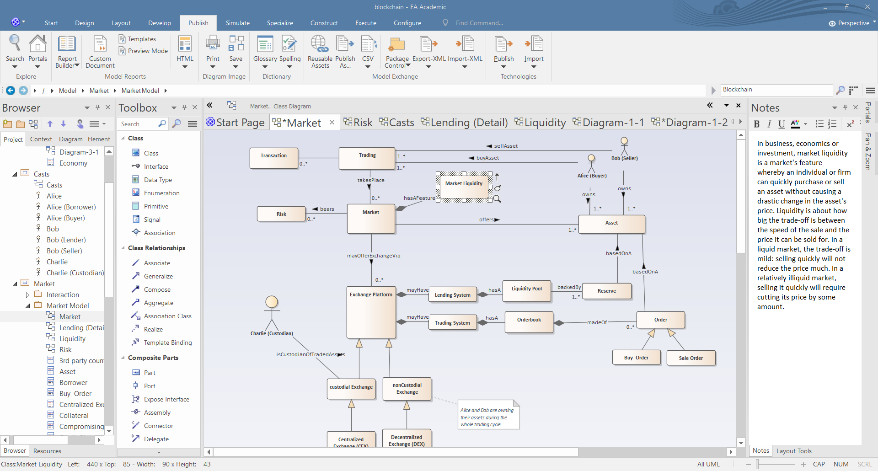
Well, fifty years later, there are a variety of diagramming tools available, which automate the process of modeling systems via diagramming. When it comes down to model complex systems, I believe Sparx Enterprise Architecture is the most versatile.
Enterprise Architect helps individuals, groups and large organizations model and manage complex information. By integrating and connecting a wide range of structural and behavioral information in visual form, you can build a coherent, verifiable model of what-is or what-will-be.
[2]
The article series is centered around the development of an Ontology in the context of Decentralized Finance concepts (our subject matter).
So what is an Ontology then? Think of
an ontology as a model that represents some subject matter… An Ontology communicates what kinds of things there are (for the subject matter of interest) and how they are related to each other.
[3]
Ontologies are everywhere; in essence, software uses ontologies at its core to interact with each other. They may be named differently, for example, product catalogs, knowledge graphs, data structures that capture models of the entities in the world in which a system interacts, but they play an important role.
An ontology allows us to build up a common understanding of the structure of information among people or software agents, as well as establish a re-usable domain knowledge base. Even if the task may be hard to achieve:
… ontologies sure a hard to build. Understanding how the entities in some application areas might be modeled, how they might interrelate with one another, and how they might be captured in software is really difficult. [3]
The exercise on its own is valuable in know-how build-up by the writer (and hopefully reader of the series) in the topics of Decentralized Finance, as well as the usage of Ontology models.
The intention is to build the DEFI model up on the family of ontology specifications called the Financial Industry Business Ontology (FIBO).
FIBO is a modularized formal model of the concepts represented by finance industry terms as used in official financial organization documents such as contracts, product/service specifications, and governance and regulatory compliance documents. This is referred to as a Business Conceptual Model as distinct from models or descriptions of data or IT implementations. [4]
Stay tuned, in the next weeks and months; we develop an overall model of the decentralized finance domain with the help of an ontology and diagrams, which helps us to understand better what’s going on
In the meantime go back in history and watch the full video of the Mergenthaler Diagrammer, an amazing engineering piece from the early days of the computer:
|
[2]
|
“Sparx Enterprise Architect,” Sparx, [Online]. Available: https://sparxsystems.com/.
|
|
[3]
|
M. Uschold, “Demystifying OWL for the Enterprise,” Morgan Claypool Publishers, 2018.
[Online]. Available: https://books.google.ch/books?id=WuReDwAAQBAJ&lpg=PP1&hl=de&pg=PP1#v=onepage&q&f=false.
|
|
[4]
|
N. F. Noy and D. L. McGuinness, “protege.stanford.edu,” Stanford University, [Online].
Available: https://protege.stanford.edu/publications/ontology_development/ontology101-noy-mcguinness.html.
|
comments powered by Disqus