DevOp Notes: Monitoring Nginx and its underlying Web Components
Under the acronym “DevOps Notes” I publish my technical findings, which were gathered during the bootstrapping phase of my first cloud based side-project, the so-called “
Cloudburo Publishing Bot”.
“The Cloudburo Publishing Bot Platform enables Micropreneurs, Small and Medium Enterprises (SME), as well as enthusiastic blogging hobbyists to establish a Content Marketing Presence with minimal effort which is centered around Evernote.”
You can find a description of the Evernote based blogging solution in the following Medium Article:
So let’s move on to the tech note:
An essential component within the Publishing Bot platform is “
nginx”, the well-known high performance Webserver.
The main task of the Publishing Bot is to extract a user’s Evernote Blog Article and convert it into a static blog website (based on the brilliant static Website Framework
MiddleMan).
Each blog site managed by the Publishing Bot will be automatically configured into the Nginx instance running on the Publishing Bot Instance.
Until recently I used a very basic monitoring of my docker instance until I got aware of Amplify, which offers a brilliant free monitoring solution (
https://amplify.nginx.com)
Amplify is a free, modern, low barrier monitoring tool. It comes directly from the company behind NGINX. With the focus on NGINX and the underlying web site components, Amplify will make your web site more reliable and predictable.
What you have to do, is to create an account at their site and follow the configuration steps instructions, which are straightforward.
For example do enable the monitoring in my Publishing Bot Docker instance (with its configured nginx instance), the only thing I had to do, is to add the following line to the
Dockerfile:
  # Install Nginx Amplify Monitor
  RUN curl -L -O https://github.com/nginxinc/nginx-amplify-agent/raw/master/packages/install.sh \
      && API_KEY=‘xxxx15x0e610xxxxaa80axxead' sh ./install.sh
  ADD nginx-conf /etc/nginx/conf.d
The
ADD command will copy the following file into the
conf.d directory
  server {
      listen 127.0.0.1:80;
      server_name 127.0.0.1;
      location /nginx_status {
          stub_status on;
          allow 127.0.0.1;
          deny all;
      }
  }
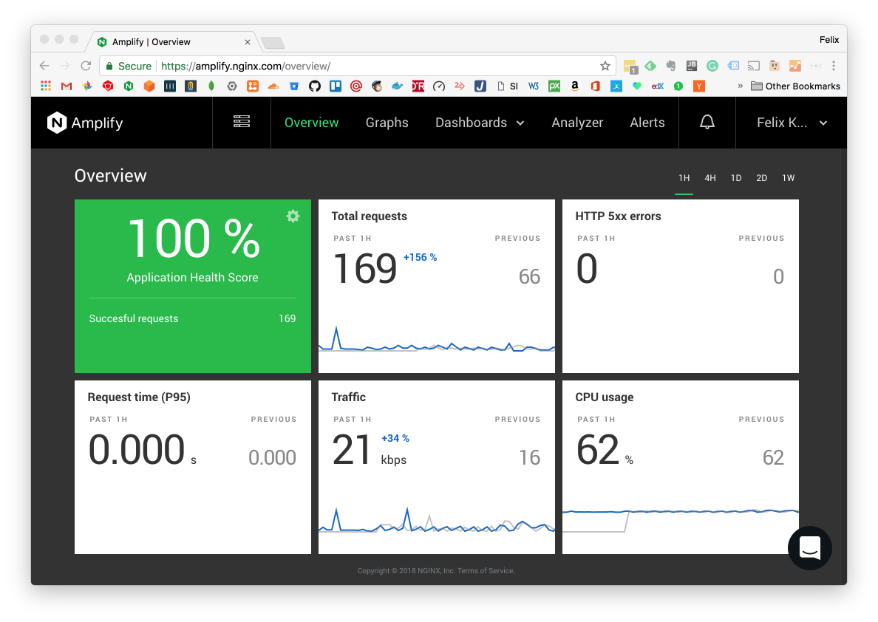
Within minutes the Amplify Dashboard gets filled with useful monitoring data.
Some examples:
Main Dashboard
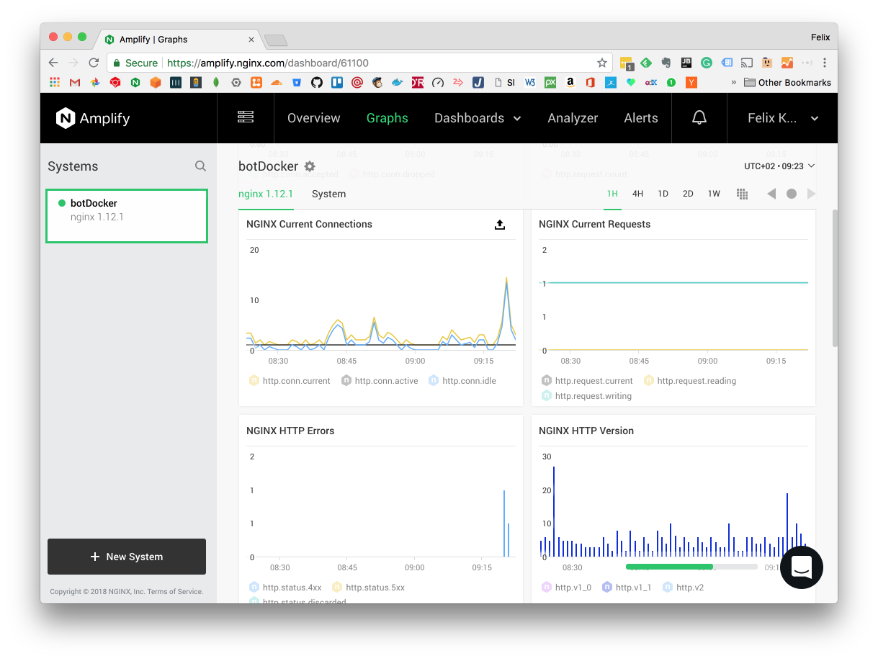
A Multitude of
Graphs are offered
:
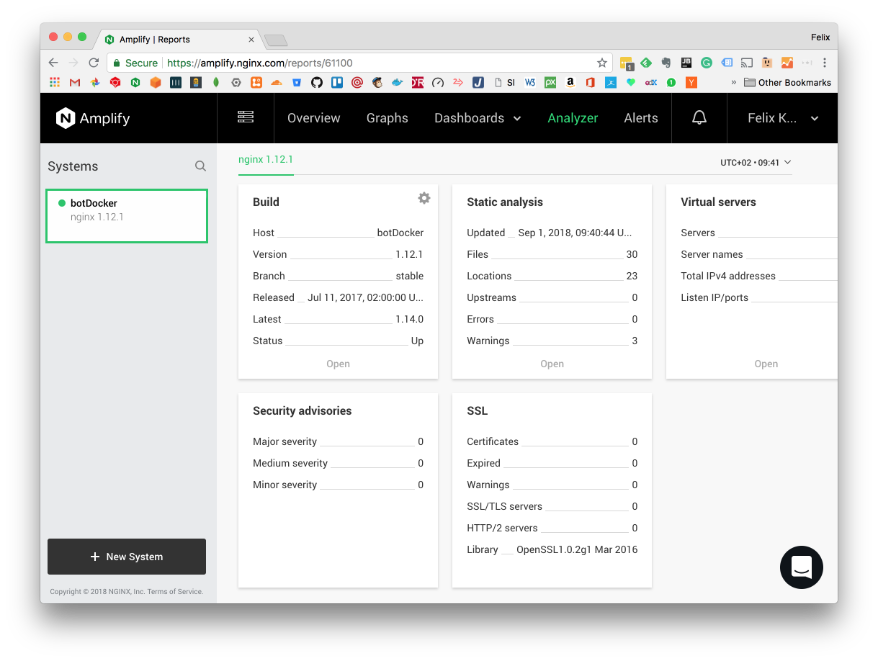
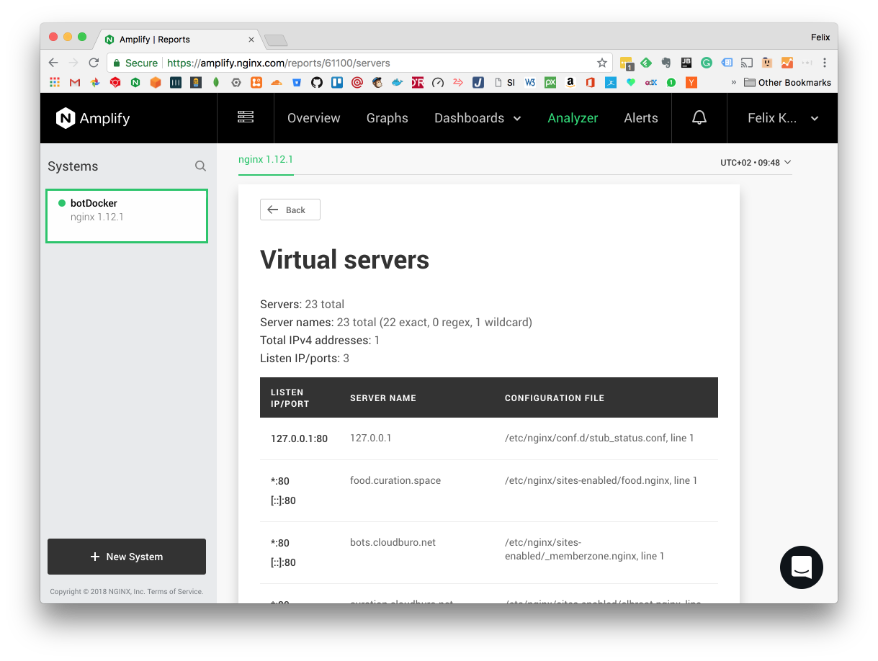
The
Analyzer allows you to check the overall configuration, as well as various analysis tasks are offered.
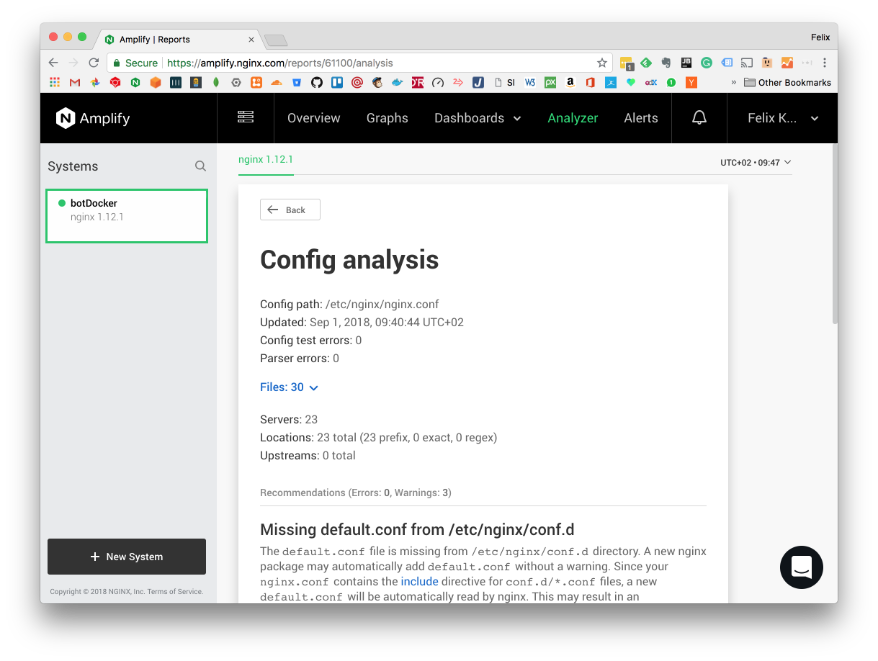
The
Config analysis checks for errors and provides as well recommendations to improve your overall Nginx configuration
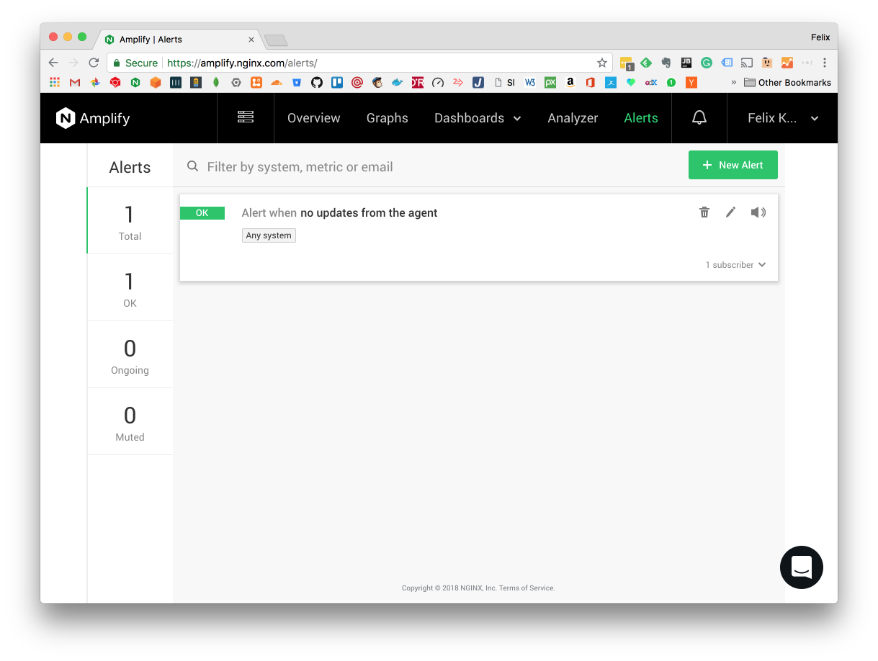
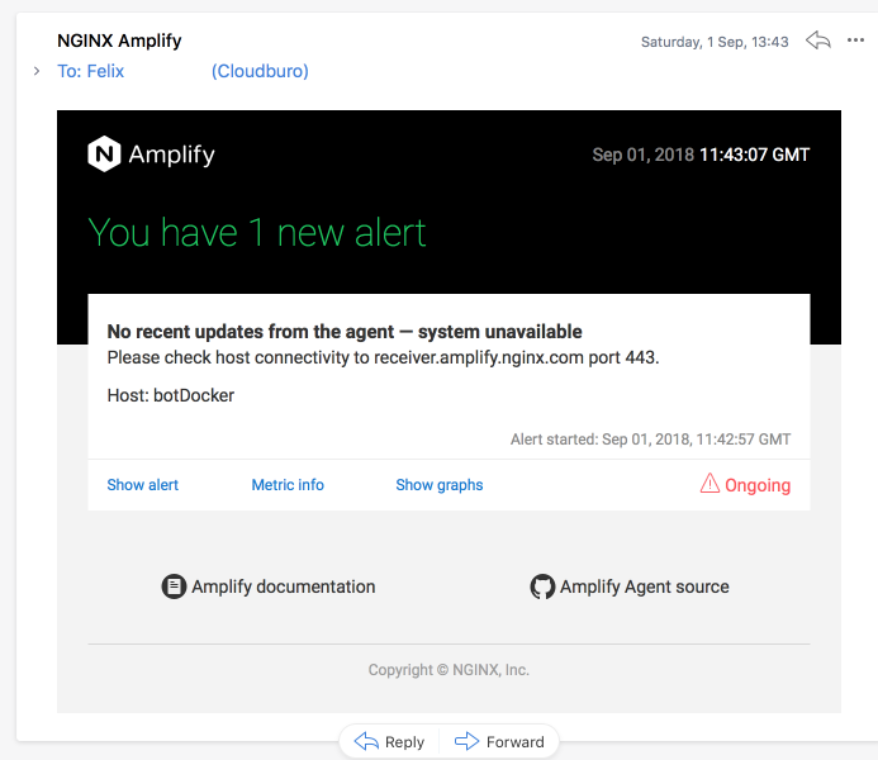
Finally you can define
Alerts, which will inform you via Email in case of problems.
A incredible useful tool to monitor your Nginx hosted website, what do you need more ?
comments powered by Disqus